What makes a hot housing market? Every day there’s a new news story with a list of top performing cities — but do these cities really reflect what is going on in the real estate market?
At Home Value Forecast (HVF), we believe that a housing market’s health is made up of many factors. Much like a doctor who looks at multiple vital signs to make a diagnosis, we analyze multiple data points, track trends and use consistent methodology in our rankings. This month’s top ten include:
- Colorado Springs, CO
- Boise City, ID
- Grand Rapids-Wyoming, MI
- Modesto, CA
- Oakland-Hayward-Berkeley, CA
- Ogden-Clearfield, UT
- Portland-Vancouver-Hillsboro, OR-WA
- Sacramento-Roseville-Arden-Arcade, CA
- Salt Lake City, UT
- Stockton-Lodi, CA
Just like a diagnosis can be wrong if only looking at one vital sign, let’s look at what would happen if we used just a single criteria to define “hot.”
Sold Price Percent Change
Many lists like to look at sold price percent change as an indication of a hot market. Looking at the below list however shows a mix of communities at different stages of recovery. Of the ten, five markets are “soft” according to our market condition ranking, while five are either “strong” or “hot.”
Top Ten Sold Price Percent Change
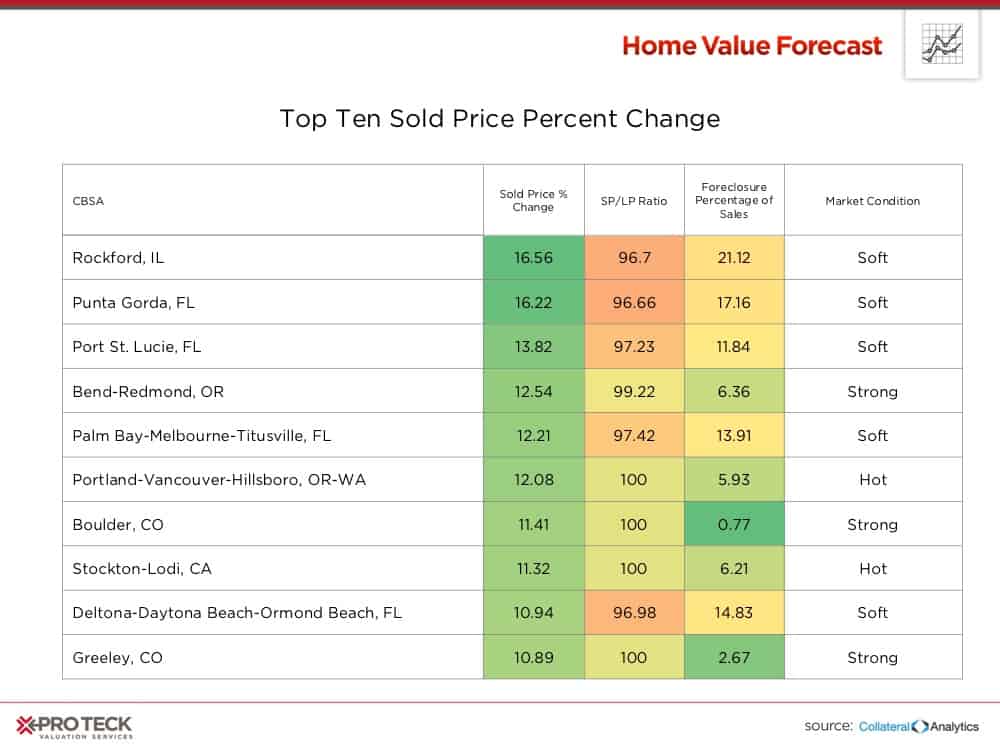
In addition to Sold Price Percent Change, the above chart shows two of the other nine (total) indicators we look at when coming up with our rankings (Sold Price to List Price Ratio, Foreclosure as a Percentage of Sales). It is color formatted in order to show how they rank in comparison to the other 200 CBSAs, with green being the top and red the bottom.
Looking closer at the top two cities one can see the danger of relying soley on this single data point. Let’s take a closer look at Punta Gorda, Florida and Boulder, Colorado to see why:
Boulder and Punta Gorda Forecast
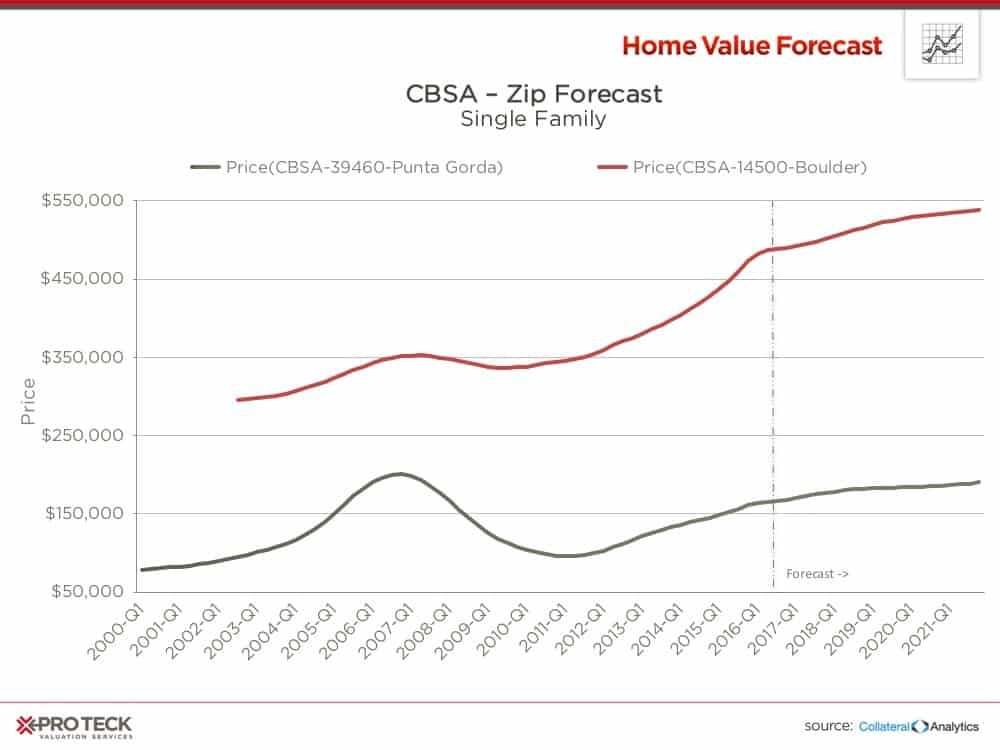
Punta Gorda was #2 on the list, Boulder #7.
A homeowner in Punta Gorda who purchased a home for $200,000 in 2007 but could only sell it for $160,000 today would not think Punta Gorda is a “hot” market. On the other hand, the person in Boulder who bought for $350,000 would be thrilled to be able to now sell for $480,000 or more.
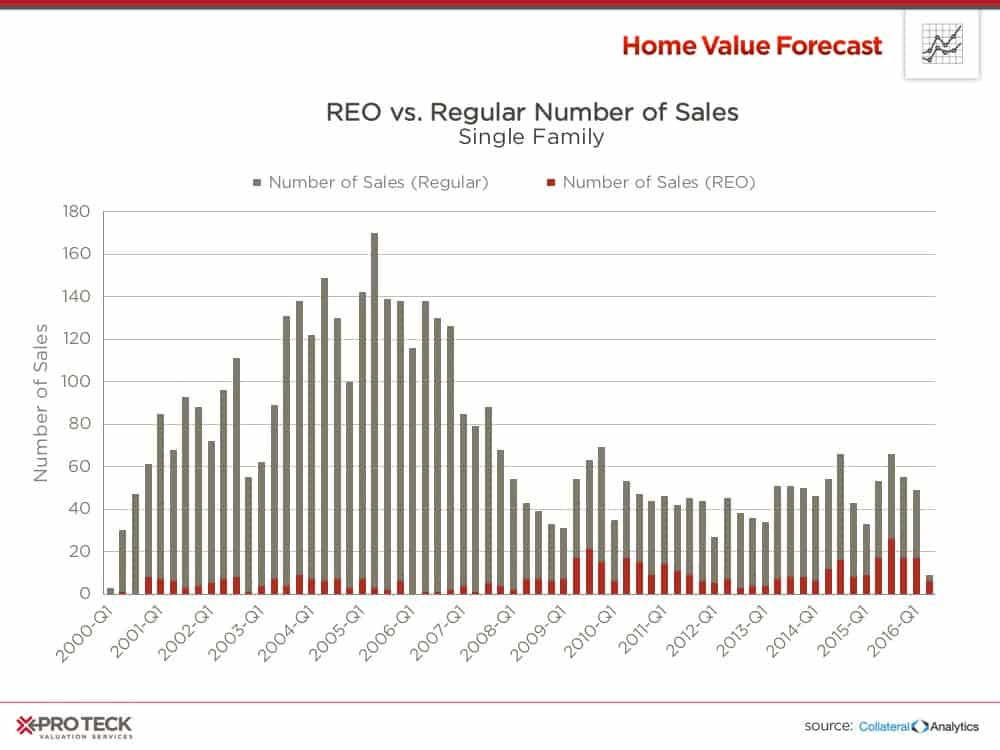
Looking to the column all the way to the right above highlights the role of foreclosure percentage on recovery. All the “hot” or “strong” markets have foreclosure sales as a percentage of market sales of 6% or less. Punta Gorda is at more than 17% — let’s look at the impact on home prices.
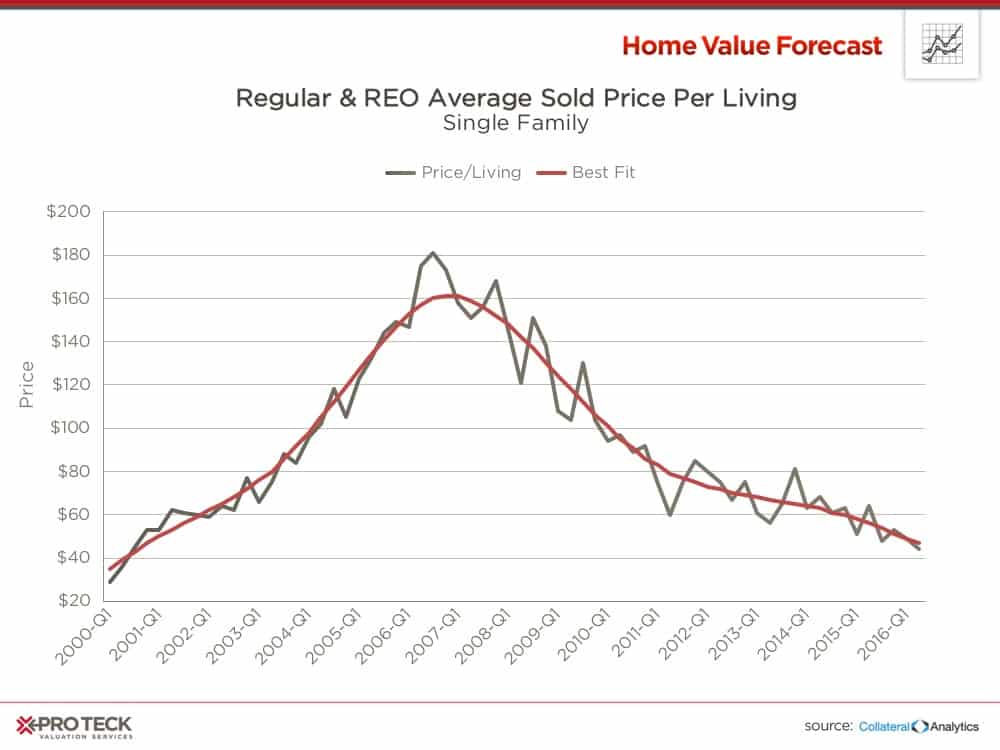
REO versus Regular Sold Price per Living
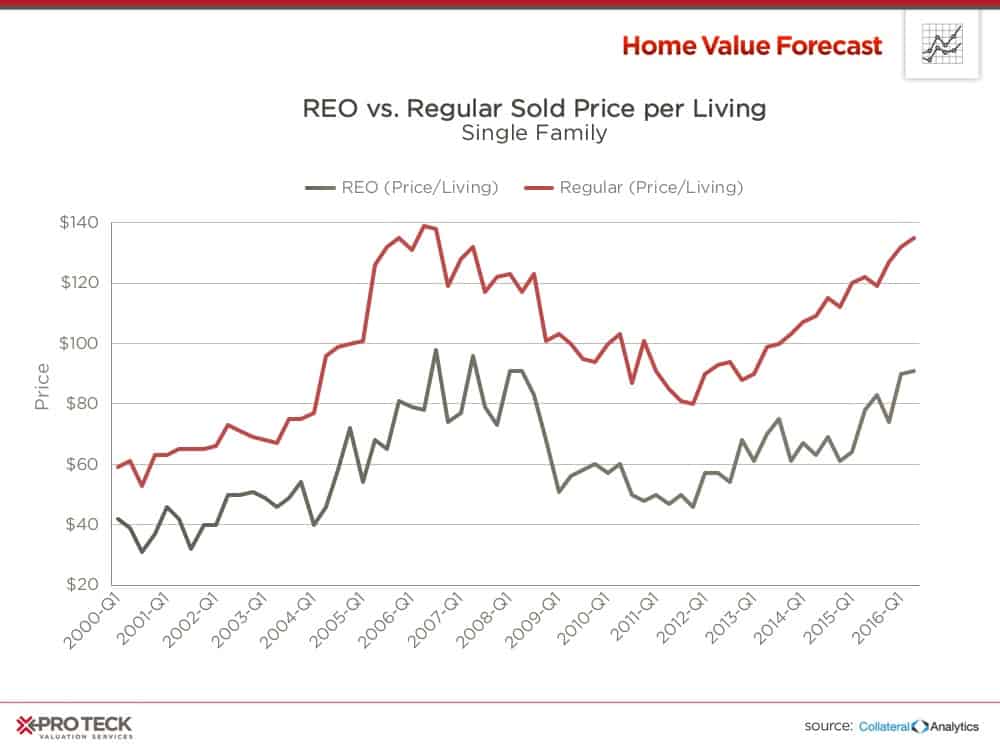
Foreclosed properties sell at a discount, which slows appreciation. In a healthy market, the REO discount, represented above by the space between the lines, shrinks as market fundamentals of supply and demand return to drive the real estate market.
Top Three Sold Percent Change Forecast
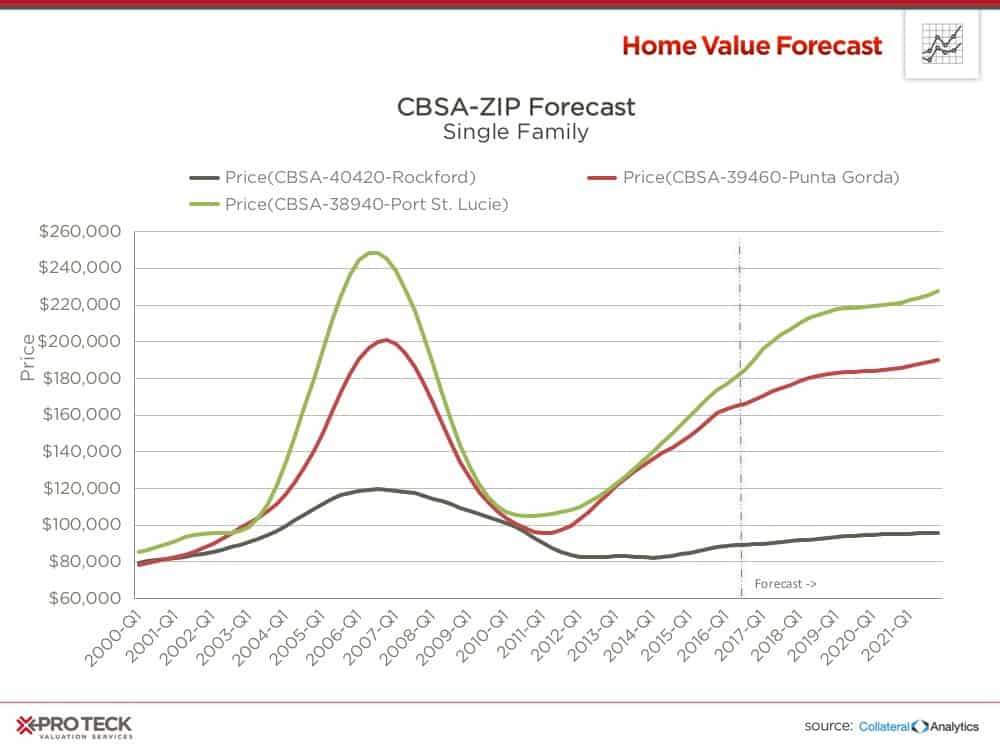
The top three will continue their recoveries but are not forecasted to exceed pre-crash highs during the next five years.
CBSA Winners and Losers
Each month, Home Value Forecast uses a number of leading real estate market-based indicators to rank the single-family home markets in the top 200 CBSAs and highlight the strongest and weakest metros.
The ranking system is purely objective and is based on directional trends. Each indicator is given a score based on whether the trend is positive, negative or neutral for that series. For example, a declining trend in active listings would be positive, as will be an increasing trend in average price. A composite score for each CBSA is calculated by summing the directional scores of each of its indicators. From the universe of the top 200 CBSAs, we highlight each month the CBSAs which have the highest and lowest composite scores.
The tables below show the individual market indicators that are being used to rank the CBSAs, along with the most recent values and the percent changes. We have color-coded each of the indicators to help visualize whether it is moving in a positive (green) or negative (red) direction.
Top 10 CBSAs
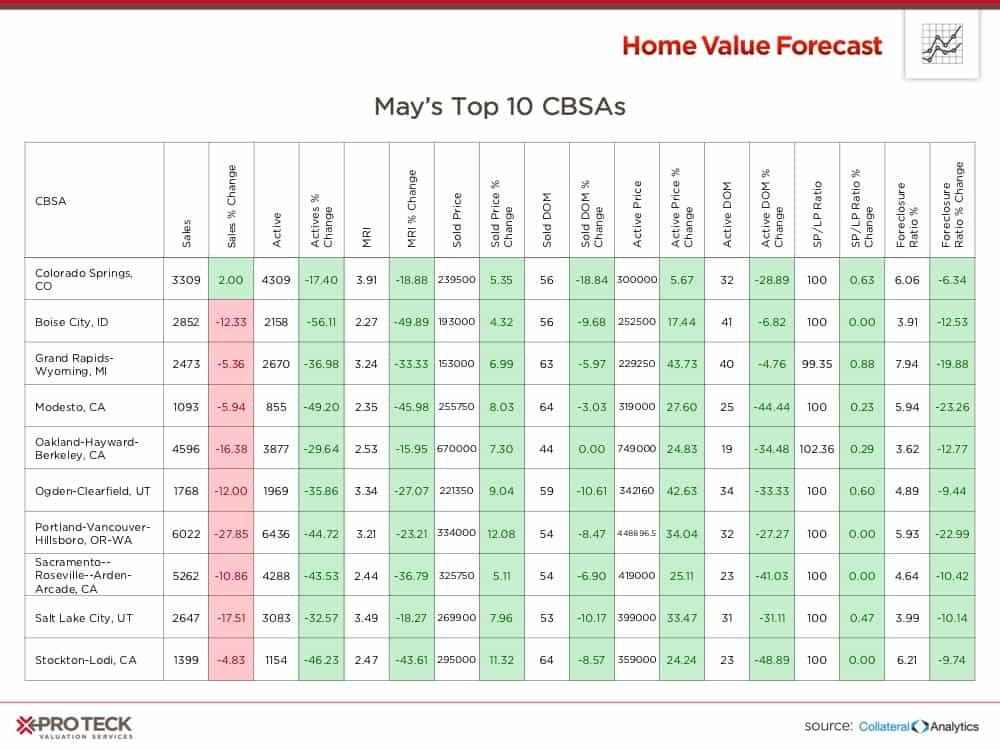
Western states are dominating our top ten list, with limited inventory leading to quick sales and high sales price to list price ratios. In fact, the lowest SP to LP ratio was Grand Rapids at 99.35% — all others were at or above 100%
Bottom 10 CBSAs
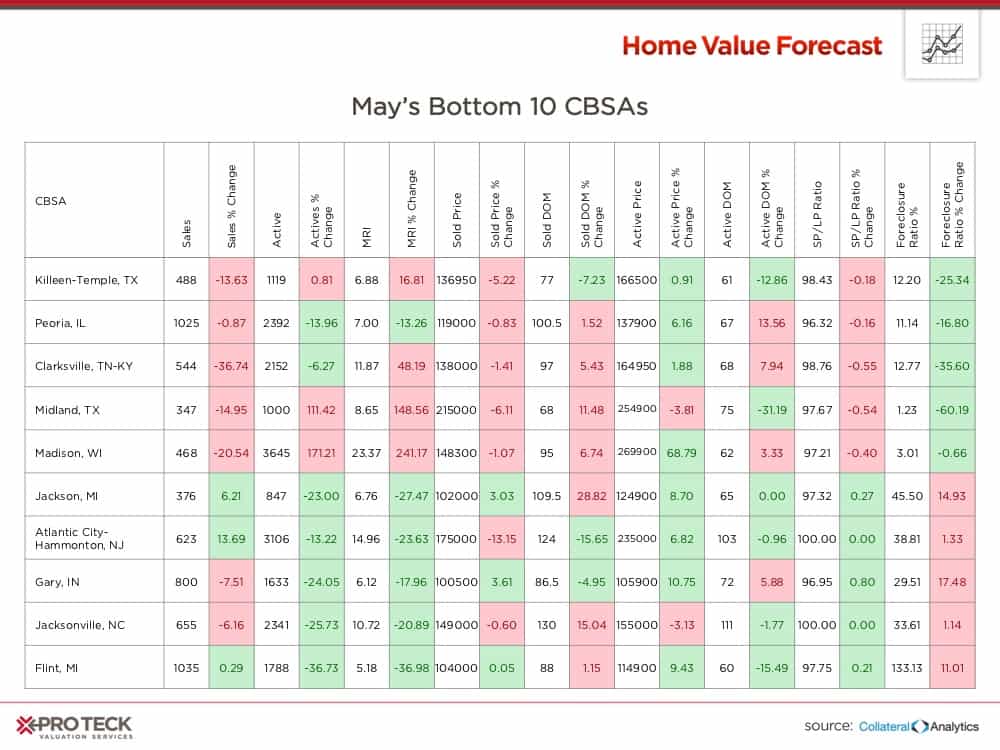
The bottom ten has some familiar metros, including Midland, Madison and Atlantic City.
Atlantic City is experiencing city management issues, which when combined with a decline in gaming revenue, is beginning to take a toll on real estate prices.
An uptick in REO sales to numbers not seen since the financial crisis leaves us pessimistic to the health of Atlantic City’s real estate market for the foreseeable future.
About Home Value Forecast
Home Value Forecast (HVF) is brought to you by Pro Teck Valuation Services. HVF provides insight into the current and future state of the U.S. housing market, and delivers 14 market snapshot graphs from the top 30 CBSAs.
HVF is built using numerous housing and economic data sources. The top 750 CBSAs as well as data down to the ZIP code level for approximately 18,000 ZIPs are available with a corporate subscription to the service.
Also, Pro Teck Valuation Services offers reporters the following:
- National, regional or metro level housing data
- Monthly Updates and HVF Insights articles
- By-request data for your story — custom data, heat maps and charts are available
- Expert commentary from Home Value Forecast Editorial Committee:
- Tom O’Grady, Chief Executive Officer, Pro Teck Valuation Services
- Michael Sklarz, PH.D., President, Collateral Analytics
- Jeff Dickstein, Chief Compliance Officer, Pro Teck Valuation Services
