Each month, Home Value Forecast uses a number of leading real estate market-based indicators to monitor single-family home market activity in the nation’s top 200+ metropolitan areas (CBSAs) and report on the Top 10.
THE TOP 10
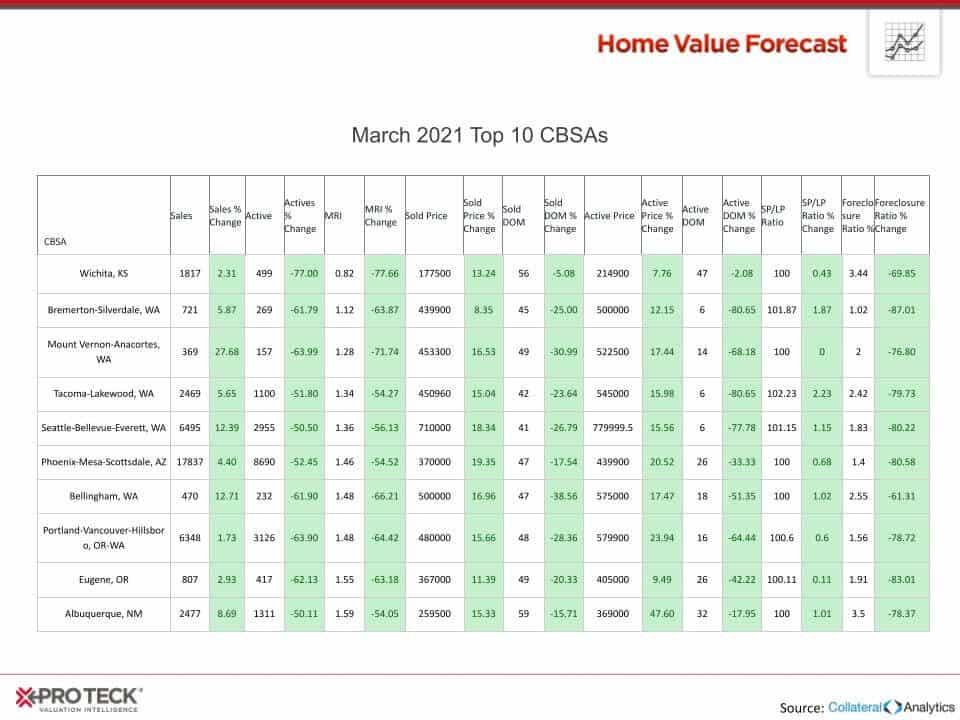
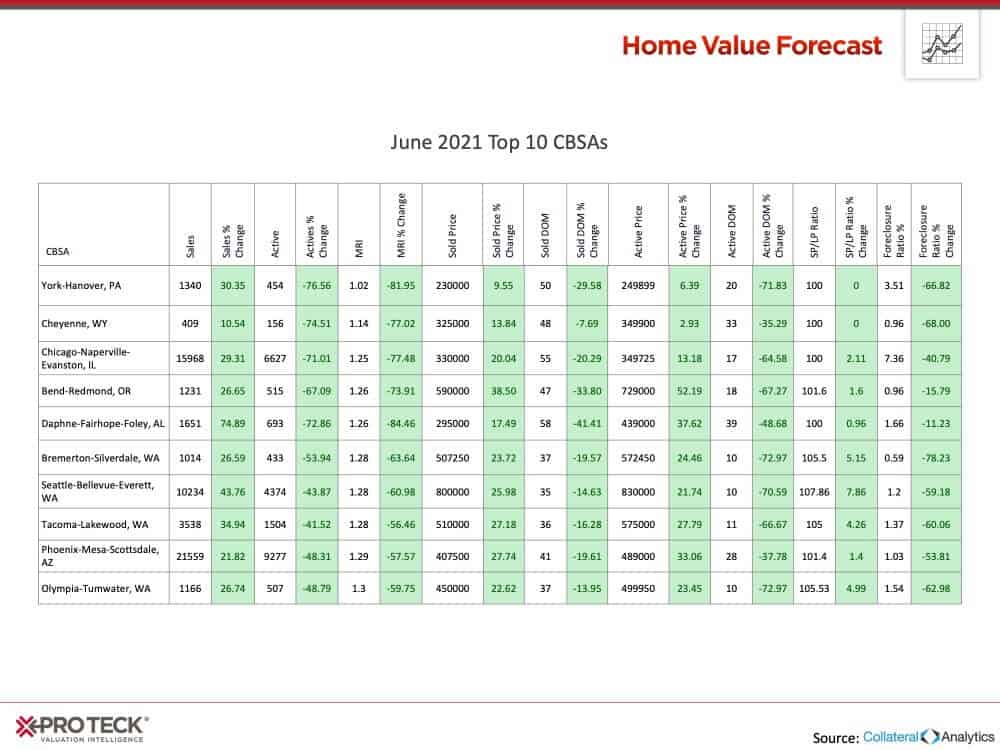
The Home Value Forecast Top 10 Hottest Housing Markets ranking system is purely objective and is based on directional trends over the past eight quarters. It’s not a listing of what markets are most expensive or most in need of inventory; it ranks market momentum at a specific point in time.
This month’s Top 10 has four metros from Washington state and all had Months of Remaining Inventory (MRI) under 1.3 months:
218 of the 229 metros we track had a sales price to list price ratio of 100% or more, meaning that houses (on average) are selling at or above asking in 95.2% of the CBSAs. The Top 20 metros selling over asking price include:
| CBSA_NAME | SP_LP_Ratio |
| Oakland-Hayward-Berkeley, CA | 111.5 |
| San Francisco-Redwood City-South San Francisco, CA | 109 |
| Austin-Round Rock, TX | 108.7 |
| San Jose-Sunnyvale-Santa Clara, CA | 108.38 |
| Seattle-Bellevue-Everett, WA | 107.86 |
| Rochester, NY | 106.76 |
| Santa Cruz-Watsonville, CA | 106.32 |
| Cambridge-Newton-Framingham, MA | 106.25 |
| San Rafael, CA | 105.98 |
| Olympia-Tumwater, WA | 105.53 |
| Bremerton-Silverdale, WA | 105.5 |
| Tacoma-Lakewood, WA | 105 |
| Denver-Aurora-Lakewood, CO | 104.9 |
| Lewiston-Auburn, ME | 104.72 |
| Manchester-Nashua, NH | 104.72 |
| Buffalo-Cheektowaga-Niagara Falls, NY | 104.62 |
| Stockton-Lodi, CA | 104.56 |
| Worcester, MA-CT | 104.4 |
| Colorado Springs, CO | 104.17 |
| Boston, MA | 104.09 |
Of the 218 metros at or above 100% sales to listing ratio, 113 were above 100%. To compare, at this same same time three years, ago only 10 metros were averaging over 100%.
If you’re buying, have your checkbook ready and assume you’ll have to go over asking price to even be considered in this market.
ABOUT SVI’S MONTHLY HOUSING MARKET REPORT
The Home Value Forecast uses a ranking system that is purely objective and is based on directional trends of market indicators. Each indicator is given a score based on whether the trend is positive, negative or neutral for that series. For example, a declining trend in active listings would be positive, as would an increasing trend in average price. A composite score for each CBSA is calculated by summing the directional scores of each of its indicators.