Each month, Home Value Forecast uses a number of leading real estate market-based indicators to monitor single-family home market activity in the nation’s top 200+ metropolitan areas (CBSAs) and report on the Top 10.
The TOP 10
The Home Value Forecast Top 10 Hottest Housing Markets ranking system is purely objective and is based on directional trends over the past eight quarters. It’s not a listing of what markets are most expensive or most in need of inventory; it ranks market momentum at a specific point in time.
This month’s Top 10:
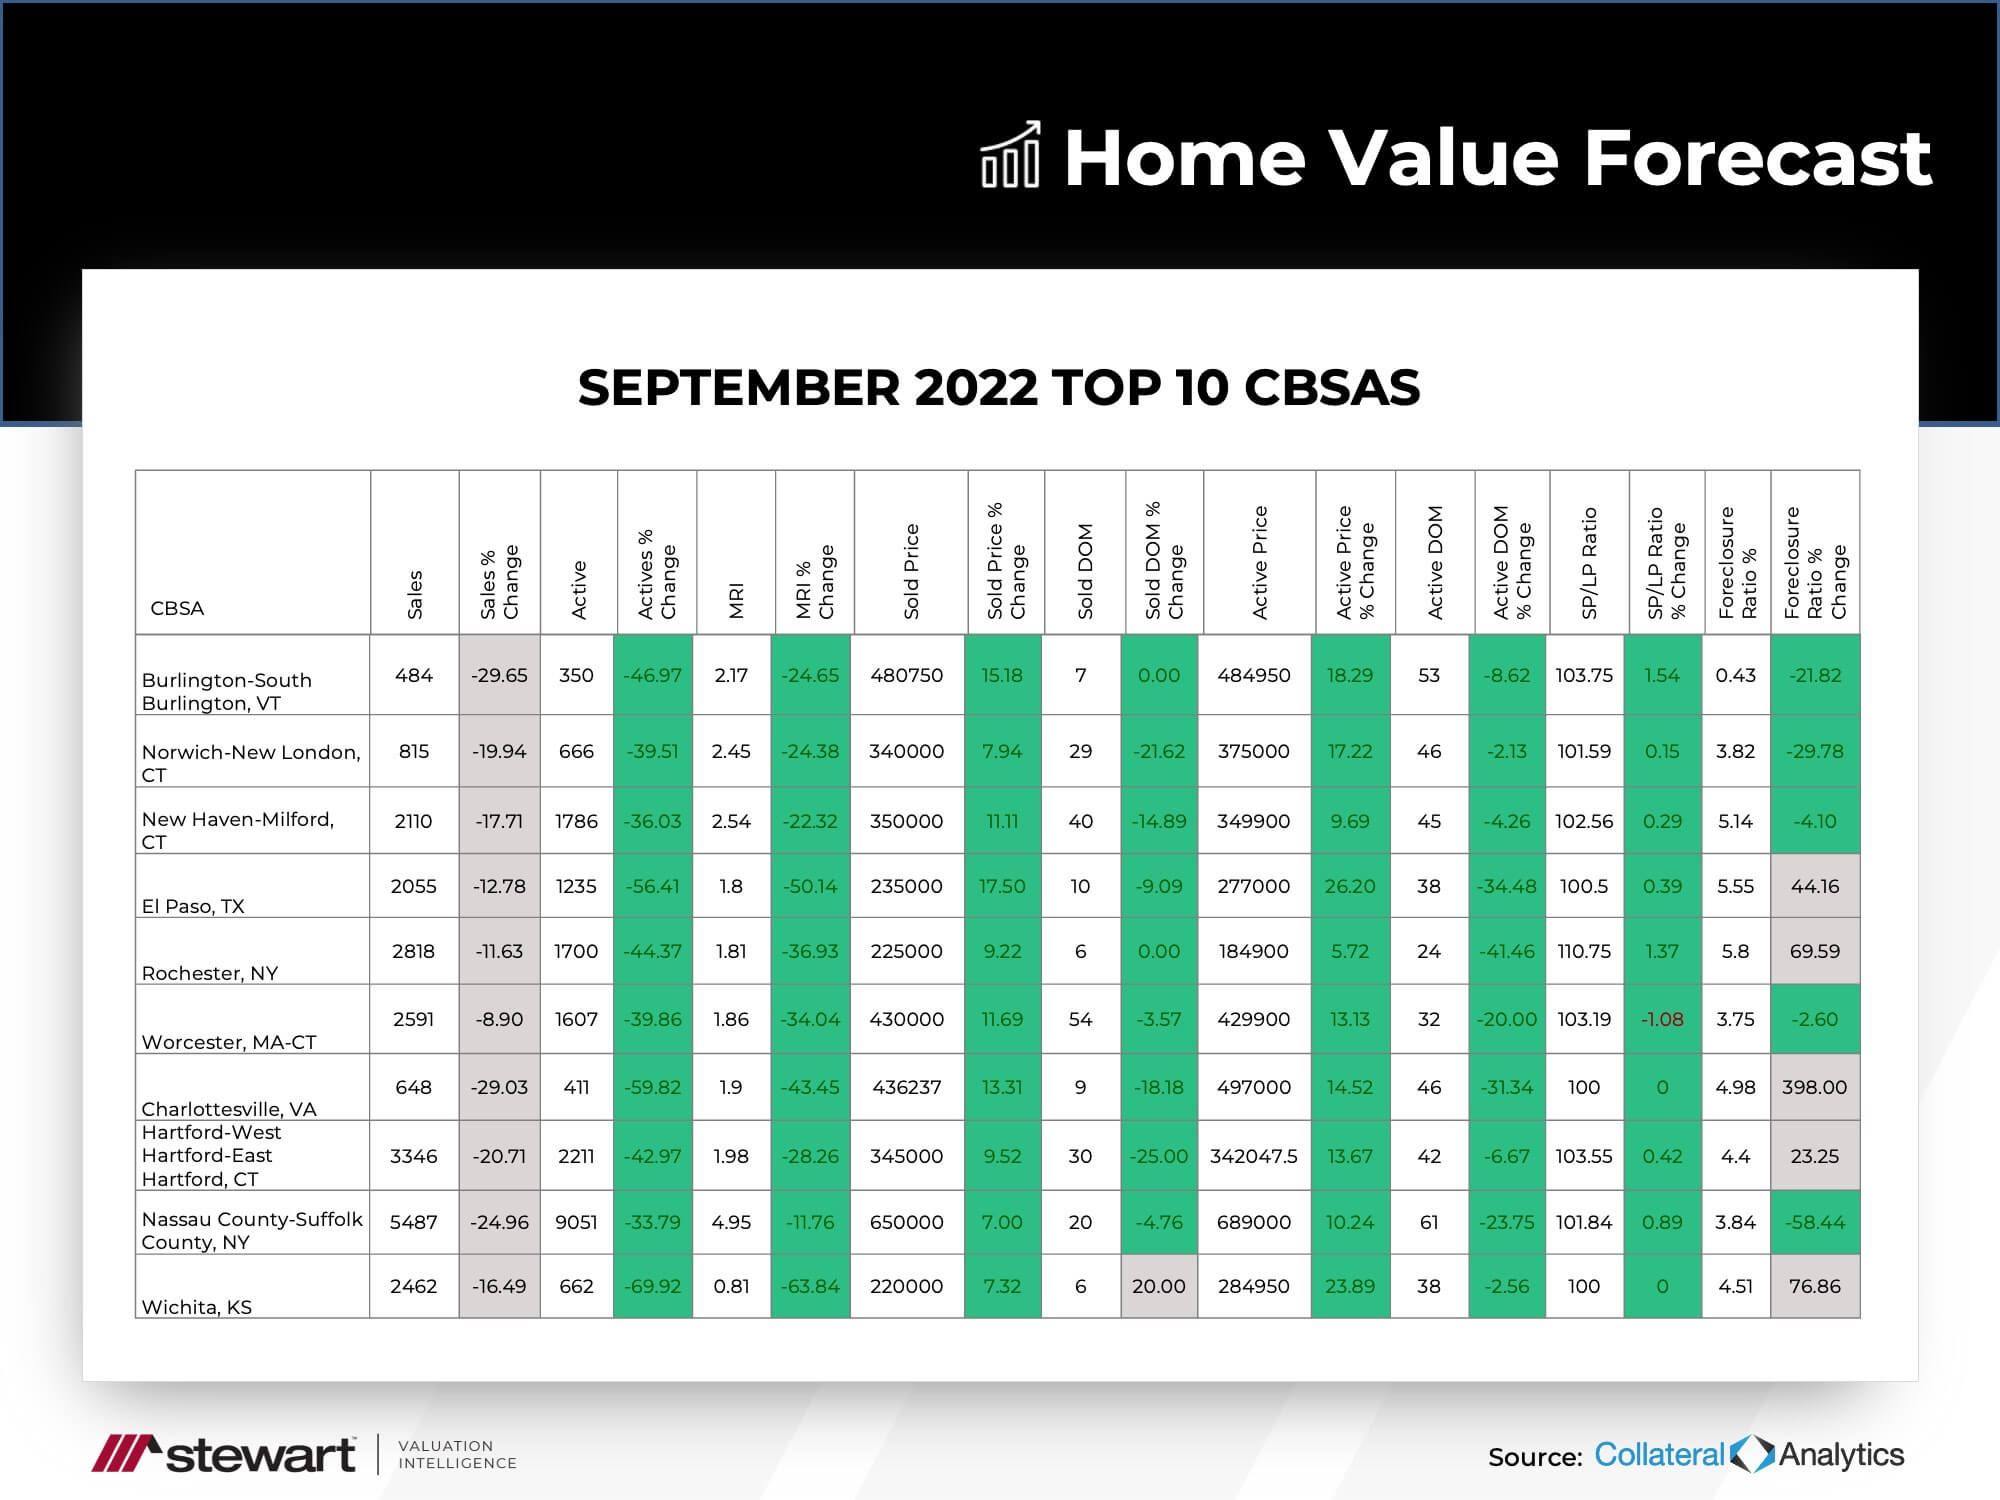
Nine of this month’s Top 10 are from smaller metros, a clear indication that the hottests markets are slowing down. Lasy year’s rapid market momentum, fueled by the pandemic-limited inventory and historically low interest rates, is a thing of the past. And while the market is still highly competitive, its starting to tilted towards a balanced market.
Market Condition
Based on our ranking system, Home Value Forecast “buckets” market conditions into seven descriptive categories: Hot, Strong, Good, Normal, Soft, Weak and Distressed. Look at the difference a year makes to the number of metros in each category.
| Market Condition | September 2022 | September 2021 |
| Hot | 8 | 160 |
| Strong | 87 | 45 |
| Good | 49 | 9 |
| Normal | 33 | 1 |
| Soft | 48 | 11 |
| Weak | 2 | 2 |
| Distressed | 2 | 1 |
Last year, 90% of the market, or 205 of the 229 metros we report on, had a market condition of Hot or Strong. Today, only 41% of the metros (95) are in the Hot or Strong category.
In a balanced market where supply and demand are in balance, the majority of the metros would be in one of the Good/Normal/Soft “middle” categories. Last year only 9% of the market was there; today 57% of the market is.
The market is still top-heavy, with not enough supply to meet demand. Higher interest rates and more housing starts should move the market more towards balance.
ABOUT STEWART VALUATION INTELLIGENCE’S MONTHLY HOUSING MARKET REPORT
The Home Value Forecast uses a ranking system that is purely objective and is based on directional trends of market indicators. Each indicator is given a score based on whether the trend is positive, negative or neutral for that series. For example, a declining trend in active listings would be positive, as would an increasing trend in average price. A composite score for each CBSA is calculated by summing the directional scores of each of its indicators.