The nationwide number of homes currently listed for sale is down approximately 21 percent from a year ago. This is one of the most important residential real estate developments in the past year and has a direct impact on price in many markets.
Figure 1 shows the percent change for a number of important markets:
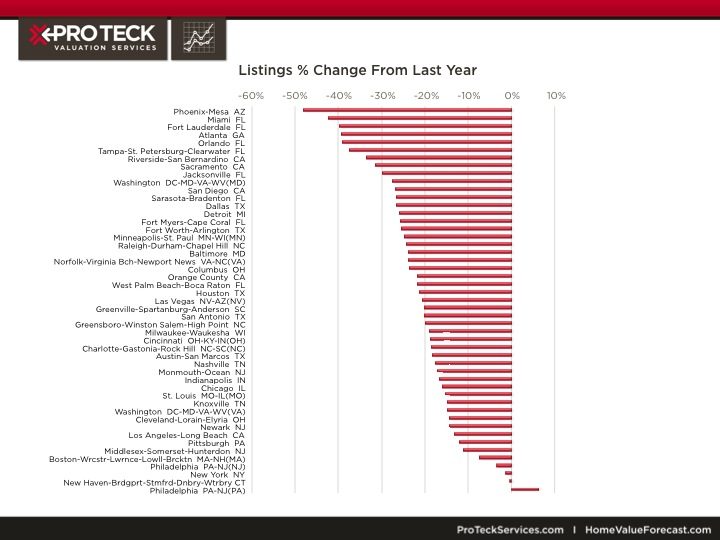
Figure 1 – Listings % Change From Last Year
It is noteworthy that Phoenix, Miami, Atlanta, Orlando, and Riverside-San Bernardino, some of the most widely followed and hardest hit since the peak markets, are high on this list.
A better leading indicator of the housing market is Months of Remaining Inventory (current number of listings/past year monthly sales rate). It combines both supply and demand in one number, giving a more holistic view of the state of the market. We have found that various levels of Months of Remaining Inventory (MRI) correspond well to area market conditions: for example, a Strong market will have 0 to 5 months of inventory, a Balanced market 6 to 10 months, Soft (11 to 15 months), Weak (16 to 20 months), etc.
Figure 2 shows the nationwide MRI, which is currently at 6.3 months, the lowest level since 2006:
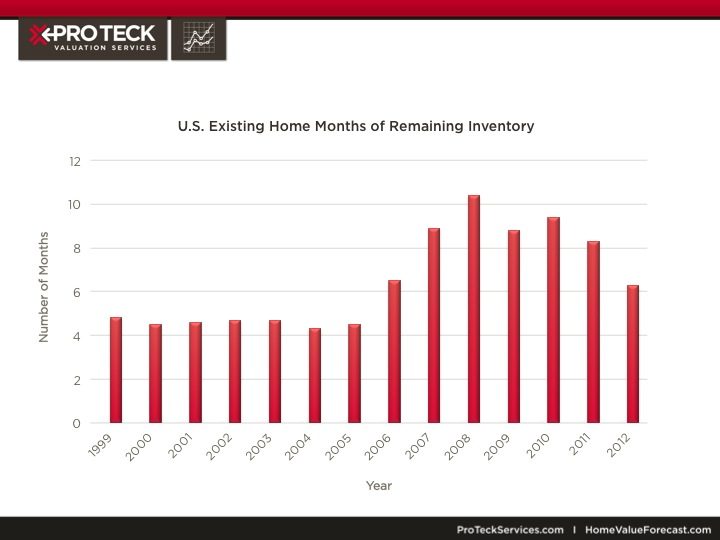
Figure 2 – U.S. Existing Home Months of Inventory Remaining
Note that the nationwide MRI was at or below the 5 month threshold throughout the 2002 to 2005 period when nationwide home prices were experiencing their largest gains.
With regard to individual metros, the current MRI values are shown in Figure 3:
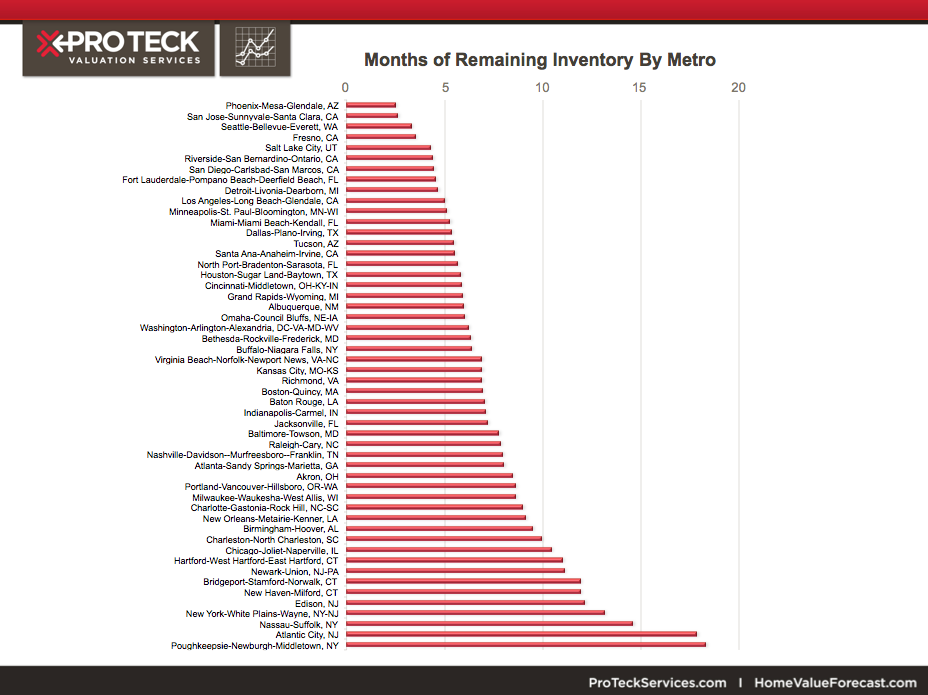
Figure 3 – Months of Remaining Inventory By Metro
It should not be surprising that markets such as Phoenix which have experienced the largest percentage declines in active listings are also those with the lowest Months Remaining values.
The fact that MRI is such an important leading indicator of home prices is supported by Figure 4 which shows the inverse relationship between the Los Angeles single family months remaining and the annual percent change in its median price:
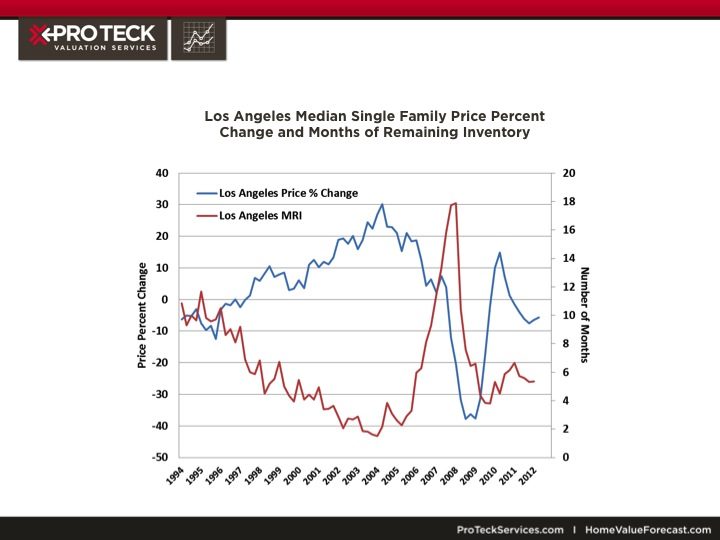
Figure 4 – Los Angeles Median Single Family Price Percent Change and Months of Remaining Inventory
In addition to the clear inverse correlation between the two series, note how MRI hits its most recent low point in late 2003 and high point in late 2007 which were more than one year before the Los Angeles home price peak and trough values.
The discussion above shows how MRI can be used to define and predict market conditions by geography. It can also be used to stratify market conditions within a particular market by price range, property type or by property characteristics. This can be seen in Figure 5 which shows current MRI for San Diego County single family homes by price per living area:
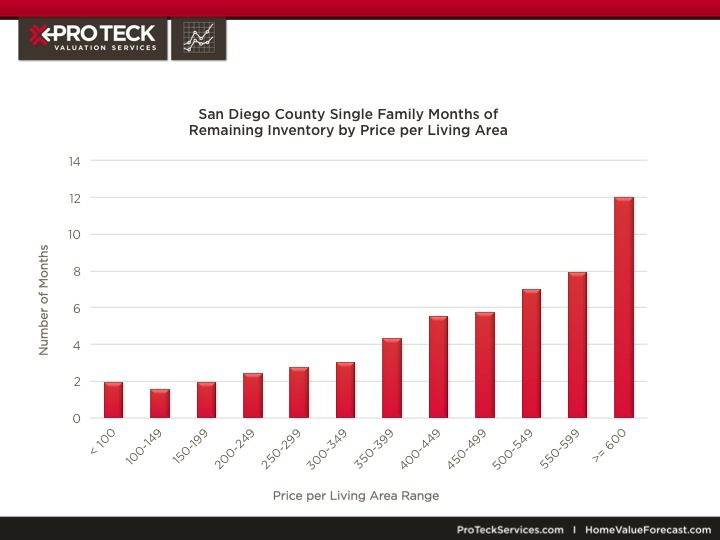
Figure 5 – San Diego County Single Family MRI by Price per Living Area
While the overall San Diego market has 4.5 months of inventory, the lower priced homes have 2 or fewer while higher priced homes have 6 or more.
CBSA Winners and Losers
Each month Home Value Forecast ranks the single family home markets in the top 200 CBSAs to highlight the best and worst metros with regard to a number of leading real estate market based indicators.
The ranking system is purely objective and is based on directional trend. Each indicator is given a score based on whether the trend is positive, negative, or neutral for that series. For example, a declining trend in active listings would be positive as will be an increasing trend in average price. A composite score for each CBSA is calculated by summing the directional scores of each of its indicators. From the universe of the top 200 CBSAs, we highlight each month the CBSAs which have the highest and lowest composite scores.
The tables below show the individual market indicators which are being used to rank the CBSAs along with the most recent values and the percent changes. We have color-coded each of the indicators to help visualize whether it is moving in a positive (green) or negative (red) direction.
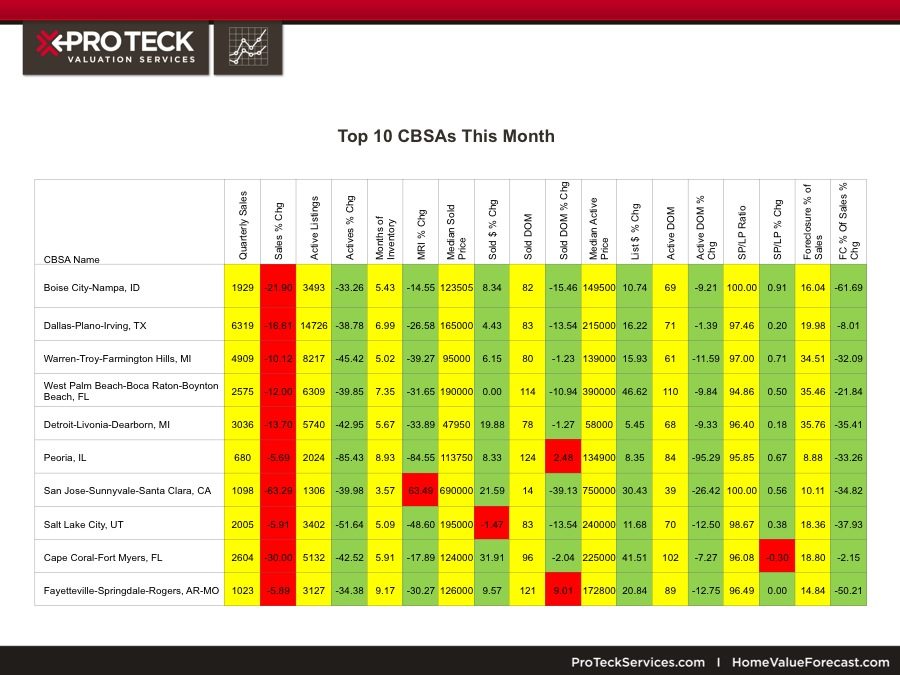
Top 10 CBSAs This Month
The top ranked metros in the current month represent a broad cross section of U.S. real estate markets. Of note are several from the “Rust Belt” (Michigan and Illinois CBSAs). One thing that these markets have in common is that they all have experienced significant declines in active listing counts over the past year. This has led to most of these currently having balanced or tight markets based on their Months of Remaining Inventory values.
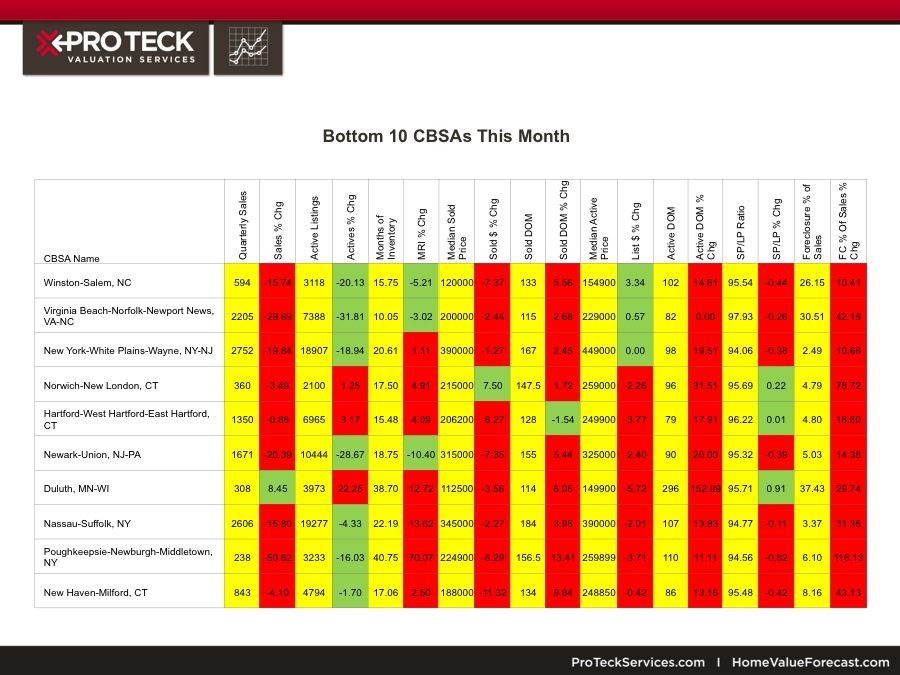
Bottom 10 CBSAs This Month
In contrast, a high percentage of the bottom ranked metros are located in the Northeast. All have double digit Months of Remaining Inventory. Price in these metros have held up much better since the market peak in 2005-06 compared to the current top ranked markets. This helps explain the relative rankings in that the bottom ranked metros are not offering same bargains as the top ranked ones with regard to compelling prices and high rental yields.
Outliers
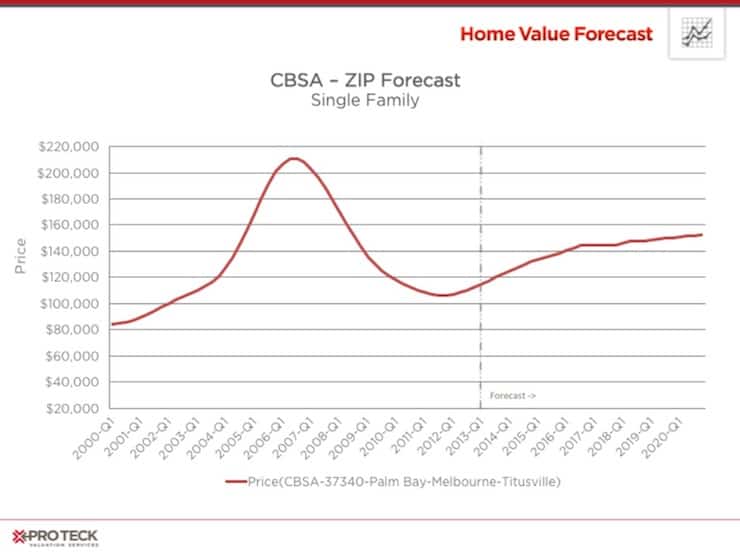
In this month’s Market Update, we will highlight the West Palm Beach-Boca Raton-Boynton Beach, FL CBSA, which is currently in the list of the Top 10 metros. As discussed above, most of the top metros have experienced significant price declines since the market peak in 2005-06, this metro is no exception. In fact, the price peak in this metro occurred in the fourth quarter of 2005 and prices have since declined 52.0 percent.
Like any market, bargain prices will bring out buyers – this is clearly happening in the West Palm Beach CBSA. As seen in the ranking table above, nearly all of its important market indicators are showing positive trends on a year-over-year basis including declining inventory, declining market times and less distressed sales activity to name a few.
Within the West Palm Beach CBSA there are numerous sub-markets. On a ZIP code level, one of interest is ZIP code 33458, located in Jupiter, FL. As seen in Figure 6 below, home prices in this ZIP code have held up better than in the overall West Palm Beach metro since the market peak:
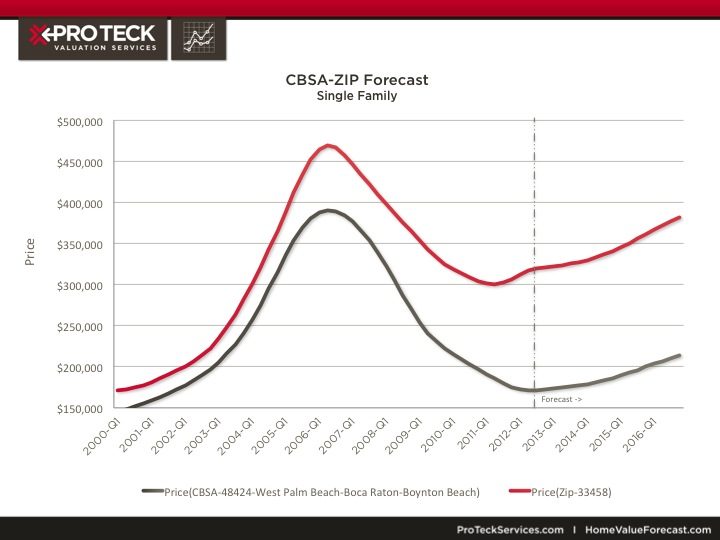
Figure 6 – CBSA – 48424 – West Palm Beach – Boca Raton – Boynton Beach | CBSA – 33458 Jupiter, FL
In addition, our forecast models call for this ZIP code to perform better than the overall CBSA over the next several years. One reason for the outperformance compared to the overall CBSA is it appears that homebuyers have been better capitalized and, thus, better able to weather declines in home prices. In addition to being one of the higher priced markets in the West Palm Beach CBSA, the ZIP code has seen buyers make larger down payments when purchasing. The average LTV ratio here has historically been around 77 percent compared to approximately 85 percent for the overall metro.
About Home Value Forecast
Home Value Forecast was created from a strategic partnership between SVI and Collateral Analytics. HVF provides insight into the current and future state of the U.S. housing market, and delivers 14 market snapshot graphs from the top 30 CBSAs.
Each month Home Value Forecast delivers a monthly briefing along with “Lessons from the Data,” an in-depth article based on trends unearthed in the data.
HVF is built using numerous data sources including public records, local market MLS and general economic data. The top 750 CBSAs as well as data down to the ZIP code level for approximately 18,000 ZIPs are available with a corporate subscription to the service. A demonstration is available upon request. Please visit the Contact Us page to reserve your trial.
To see how we can help your company with its valuation needs, please call contact us.